what that dry weight was based on how the dry matter percentages were set
the number of animals in the pen that day
the total cost to feed the pen
the price per animal.
if the refusal feed has been recorded it will show that here
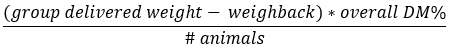
and then in the furthest right column it’s taking that dry delivered weight minus dry refusal that has been recorded divided by the number of animals in the pen to give a dry matter intake per head.
You can also see that some of the numbers are going to be color coded as those can jump out at you if they are a significant amount above or below previous days intakes. Using the maximum trend functionality makes it easier to spot deviations within pens. By setting up different presets it provides the possibility to easily check for example all the milking pens separate from the young stock and dry cow pens. image.png76.88 KB
Search pen: This allows you to apply a quick filter on pens displayed on the report. Time range: The selected time range is shown here. To change, select the dates and click on apply to use these settings. Create preset: When a certain time range or certain filters will be used often, it is possible to create a preset of these settings. This preset can then be used to quickly view the data. Each preset can be saved under to be chosen name. The preset settings can be changed through the preset area and the details button. Download: With this button, the data that is presented on the screen can be downloaded to a pdf file and saved on the computer. This is normally saved in the Download folder of the computer.
Summary per pen: For each pen and each item shown on the report, the total and/or the weighted average is shown over the selected period.
Properties (gear icon): This will enable you to customize the report. This is possible using different tabs: General:
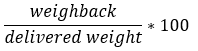
Max trend: The percentage entered here is used to show when the trend in DMI between days is higher or lower than the set max trend. When the trend is for example 5% more or 5% less than the previous day, the report will show the DMI in red. Calculation trend value percentage:
Pens: The selected pens will be shown on the report. Using ‘show not in use’ or ‘show deleted’, will give the option to include these types of pens as well.
Pen type: Each pen is set to a specific pen type. Only the selected pen types will be shown on the report.
# Animals: Shows the number of animals that were fed that day in that pen.
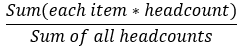
Price: Total of all ingredients prices (calculated by taking each ingredients loaded weight multiplied by its price) divided by the total weight of all ingredients multiplied by the total weight delivered to the pen (same as dry weight for a pen shown above except that ingredient dry % will be changed to price/kg of the ingredient).
In order to better understand how this site is used, we're making use of cookies to anonymously track your visit. We're not storing any personal information.


 Cookies & Tracking