Pen Delivery
With this report you can see by date, by pen:
- What the call weight was
- What the actual delivered weight was
- What the dry delivered weight was, based on how the dry matter percentages were set
- The number of animals in the pen for the deliveries of that day
- The difference in weight between the actual call weight and the actual delivered weight
- The error % between the actual call weight and the actual delivered weight
- The accuracy percentage based on the difference between the actual call weight and the actual delivered weight
- The planned cost to feed the pen
- The actual cost to feed the pen
- The deviation between the planned cost and the actual cost
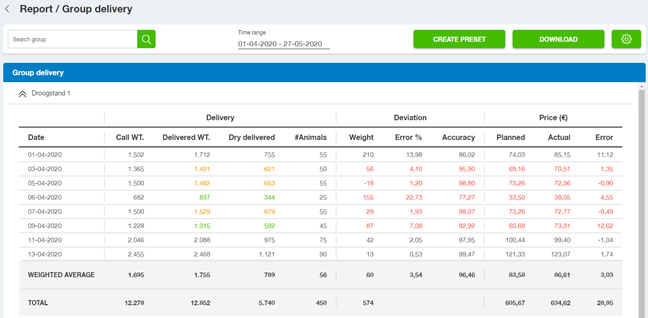
You can see that some of the numbers are colour coded when they are significant amount above (green) or below (orange) the previous deliveries. Using the maximum trend functionality makes it easier to spot deviations within pens.
When the deviation error % of the delivery exceeds this tolerance value, the data in the row will turn red. The deviation weight indicates whether too much or too little has been delivered.
Search pen: This allows you to apply a quick filter on pens displayed on the report.
Time range: The selected time range is shown here. To change, select the dates and click on apply to use these settings.
Create preset: When a certain time range or certain filters will be used often, it is possible to create a preset of these settings. This preset can then be used to quickly view the data. Each preset can be saved under to be chosen name. The preset settings can be changed through the preset area and the details button.
Download: With this button, the data that is presented on the screen can be downloaded to a pdf file and saved on the computer. This is normally saved in the Download folder of the computer.
Properties (gear icon): This will enable you to customize the report. This is possible using different tabs:
General
General
- Max trend: The percentage entered here is used to show when the trend in delivered weight between days is higher or lower than the set max trend. When the trend is for example 5% more or 5% less than the previous day, the report will show the delivered weight in green or orange. Calculation trend value percentage

- Error tolerance: The error tolerance can be set/changed by changing the %. When the deviation error % of the delivery exceeds this tolerance value, the deviation and price data in the row will turn red. The deviation weight indicates whether too much or too little has been loaded.
- Show inside tolerance: It is possible to show or hide the deliveries inside the set error tolerance.
- Show outside tolerance: It is possible to show or hide the deliveries outside the set error tolerance.
Pens: The selected pens will be shown on the report.
Pen type: Each pen is set to a specific pen type. Only the selected pen types will be shown on the report.
Report data:
- Date: The date and time that this specific pen was fed
- Actual call weight: Shows the planned weight that should have been fed on product basis to that specific pen.
- Delivered weight: Shows the true fed weight on product basis to that specific pen.
- Dry delivered weight: Shows the true fed weight on dry matter basis to that specific pen.

- # Animals: Shows the number of animals that were fed that day in that pen.
- Deviation (weight): Sum (each ingredient actual delivered weight) – Sum (each ingredient call weight).
- Deviation (error %): (Deviation weight / call weight) * 100
- Deviation (accuracy): 100 – Error %
- Planned price: (kg planned ingredient1 * price ingredient1) + (kg planned ingredient2 * price ingredient2) + (kg planned ingredientx * price ingredientx)
- Actual price: Total of all ingredients prices (calculated by taking each ingredients loaded weight multiplied by its price) divided by the total weight of all ingredients multiplied by the total weight delivered to the pen (same as dry weight for a pen shown above except that ingredient dry % will be changed to price/kg of the ingredient).

- Price error: Actual price – planned price
Report data: Summary data per pen
# Animals
- Average:
- Total: Sum of all headcounts
Other items
- Weighted average:
- Total: Sum of all items
How did we do with this article?
 Cookies & Tracking